Catch Me If You Can — Memory Leaks
Catch Me If You Can — Memory Leaks
A retrospective on a memory leak
Introduction
Memory leaks are one of those things that, when they happen, can really throw you in at the deep end. Diagnosing them seems like a challenging task at first. They require a deep dive into the tools and components your service relies on. This close-up examination not only deepens your understanding of your service landscape, but also gives an insight into how things run under the hood. Although daunting at first glance, memory leaks are essentially a blessing in disguise.
At Elli, we do our best to minimise technical debt to a bare minimum. However, incidents still happen, and our approach is to learn and share knowledge by resolving such issues.
So, this article aims to do just this. In this post, we walk you through our approach of identifying a memory leak and share our learnings along the way.
Context
Before we dive into repairing the memory leak, we need some context on Elli’s infrastructure and where the memory leak occurred in the first place.
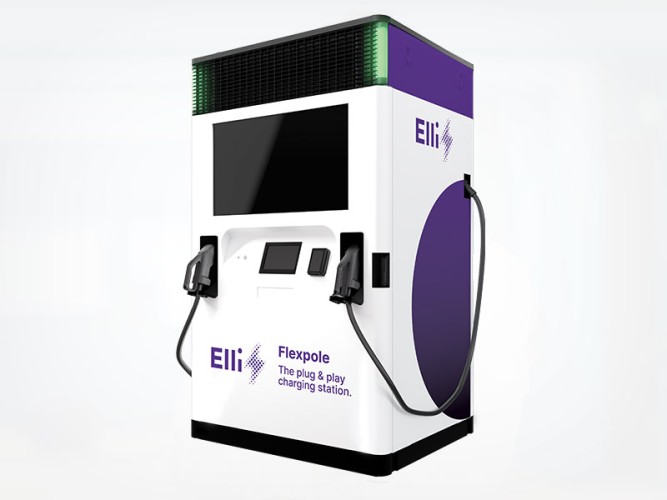
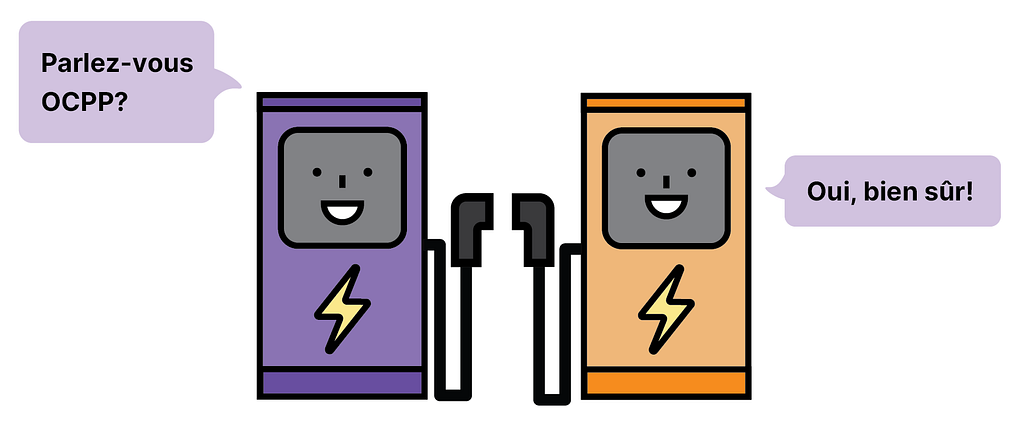
Elli, among other things, is a Charging Point Operator. We are responsible for connecting charging stations (CSs) to our backend and controlling them via OCPP protocol. Ergo, our customers can charge their EVs at private or public stations. The CSs are connected to our systems via WebSockets. When it comes to authentication, we support connections via TLS or mutual TLS (mTLS). During TLS, a CS will verify our server certificate and assure that it connects to an Elli backend. With mTLS, we also verify that the CS has a client certificate issued by us.
On the connectivity side, a server written in Node.js, is responsible for taking care of the UPGRADE logic from HTTP to WebSockets and keeping the state of the connections. It is deployed in a Kubernetes cluster and managed by a Horizontal Pod Autoscaler (HPA). Ideally, the HPA follows the traffic load and scales the pods up or down accordingly.
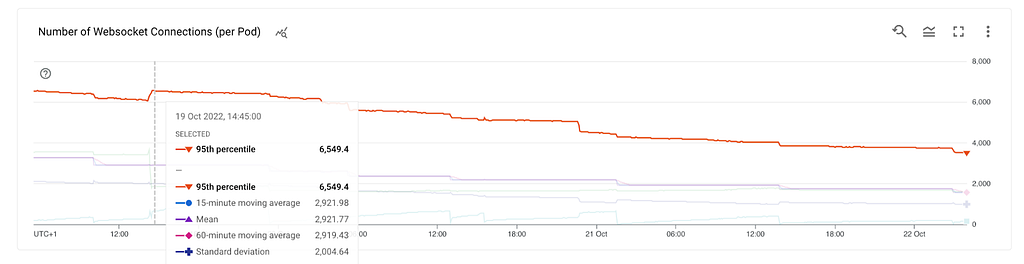
We maintain tens of thousands of persistent and long-living TCP connections from the charging stations concurrently. This introduces complexity and significantly differs from typical RESTful services. A proxy metric that tracks the load is memory utilisation since it reflects the number of established connections, and the application’s logic does not require many computations. Our pods are long-lived, and scaling via memory led us to the observation that the number of pods is slowly increasing for a constant number of connections. Long story short, we spotted a memory leak.
Impact assessment
When faced with any kind of production issue, the Elli engineering team immediately assesses the implications of this incident on our customers and the business. So upon discovering this memory leak, we made the following assessment:
The application is leaking memory in a matter of days. This means that without receiving any additional traffic our infrastructure continues to grow.
When a pod cannot handle additional traffic, thanks to the readiness probe of Kubernetes, it stops receiving additional traffic but keeps serving the established connections. A pod that would serve X connections could end up only serving a fraction of its capabilities due to the leak, without causing any disruption on the customer side. This means that we can readily absorb the impact by simply spinning up more pods.
The Investigation
Now for the actual technical deep-dive into the memory leak.
Here we explain the tools and methods we used to uncover the source behind the memory leak, what we expected to see from our experiment, and what we actually observed. We included links to the resources that we used in our investigation for your reference.
A quick primer to JS memory
Variables in JavaScript (and most other programming languages) are stored in two places: stack and heap. A stack is usually a continuous region of memory allocating local context for each executing function. Heap is a much larger region storing everything allocated dynamically. This separation is useful to make the execution safer against corruption (stack is more protected) and faster (no need for dynamic garbage collection of the stack frames, fast new frame allocation).
Only primitive types passed by value (Number, Boolean, references to objects) are stored on the stack. Everything else is allocated dynamically from the shared pool of memory called the heap. In JavaScript, you do not have to worry about deallocating objects inside the heap. The garbage collector frees them whenever no one is referencing them. Of course, creating a large number of objects takes a performance toll (someone needs to keep all the bookkeeping), plus causes memory fragmentation.
Source: https://glebbahmutov.com/blog/javascript-stack-size/
Taking a heap snapshot from a production pod | Heap Snapshots & Profiling
Expectations
We collected regular heap snapshots of our application to see an accumulation of objects over time. Due to the nature of the application, mostly holding WebSocket connections, we expected the TLSSocket objects to match the number of connections in the application. We hypothesised that when a station got disconnected, the object was somehow still referenced. Garbage collection works by cleaning up unreachable objects, so in this case, the objects would be left intact.
Results
Getting a heap dump from a 90% utilised pod resulted in the range of 100MB. Each pod requests around 1.5GB of RAM, and the heap was less than 10% of the allocated memory. This looked suspicious…
Where was the rest of the memory allocated? Nonetheless, we continued the analysis. Taking three snapshots in intervals and observing the change in memory over time didn’t reveal anything. We didn’t notice an accumulation of objects nor were there any issues with garbage collection. The heap dump looked rather healthy.
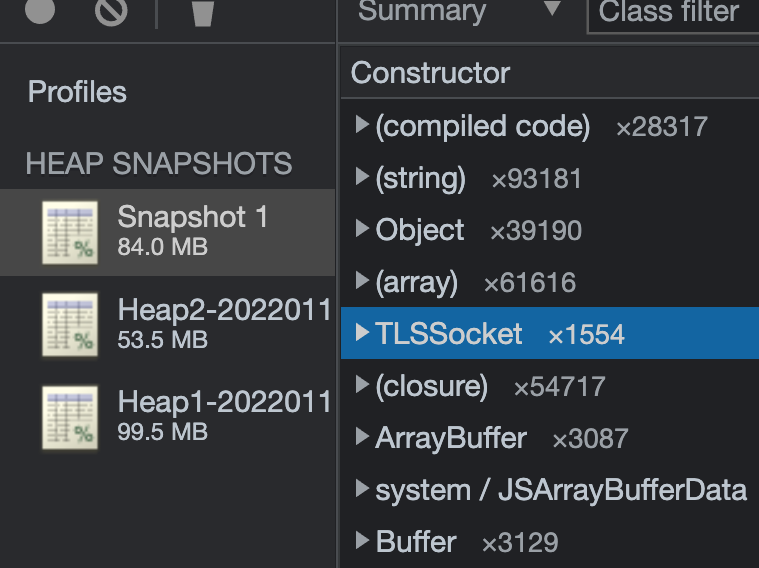
The TLSSocket objects were matching the state of the application. Going back to the first observation, the heapdump is an order of magnitude less than the memory utilisation. We thought: “This can’t be right. We are looking in the wrong place. We need to take a step back.”
In addition, we profiled the application via the Cloud Profiler offered by GCP. We were interested in seeing how objects are allocated with the passing of time and potentially identifying the memory leak.
Getting a heap dump blocks the main thread and can potentially kill the application, opposite to this the profiler can be kept in production with little overhead.
Cloud Profiler is a continuous profiling tool that is designed for applications running on Google Cloud. It’s a statistical, or sampling profiler with low overhead and is suitable for production environments.
Although the profiler contributed to our understanding of the tenants of the heap, it still didn’t give us any leads on the investigation. On the contrary, it pushed us away from going in the right direction.
Spoiler alert: the profiler, however, did provide us with quite valuable information during an incident in production where we identified and fixed an aggressive memory leak, but that’s a story for another time.
Memory usage statistics
We needed greater insights into memory usage. We created dashboards for all metrics that process.memoryUsage() had to offer.
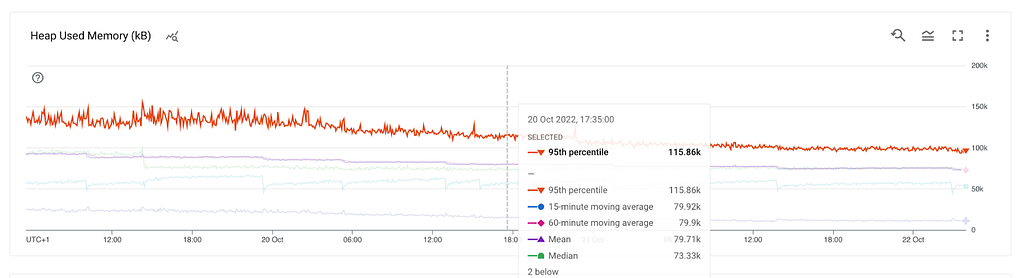
The heapTotal and heapUsed refer to V8’s memory usage.
The external refers to the memory usage of C++ objects bound to JavaScript objects managed by V8.
The rss, Resident Set Size, is the amount of space occupied in the main memory device (that is, a subset of the total allocated memory) for the process, including all C++ and JavaScript objects and code.
The arrayBuffers refers to memory allocated for ArrayBuffers and SharedArrayBuffers, including all Node.js Buffers. This is also included in the external value. When Node.js is used as an embedded library, this value may be 0 because allocations for ArrayBuffers may not be tracked in that case.
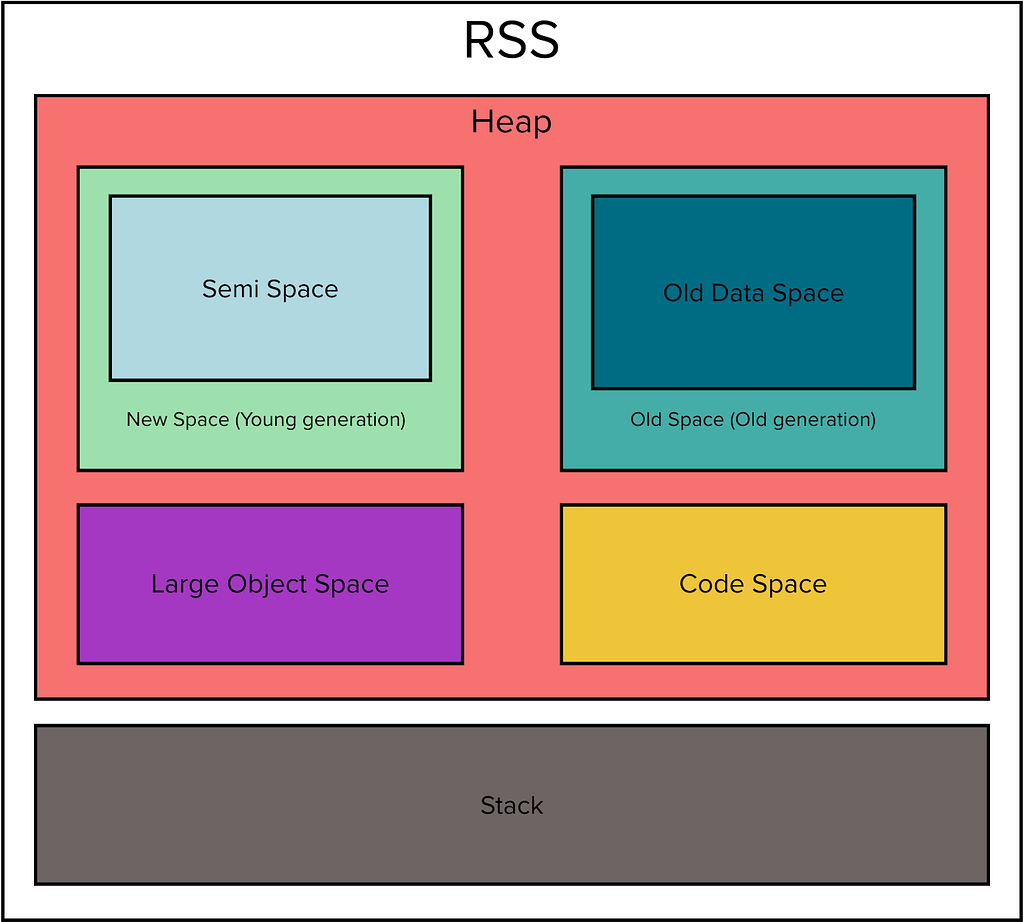
As we saw earlier we were getting ~100MB heap snapshots from a container that had more than 1 GB of memory utilisation. Where is the rest of the memory allocated? Let’s have a look.
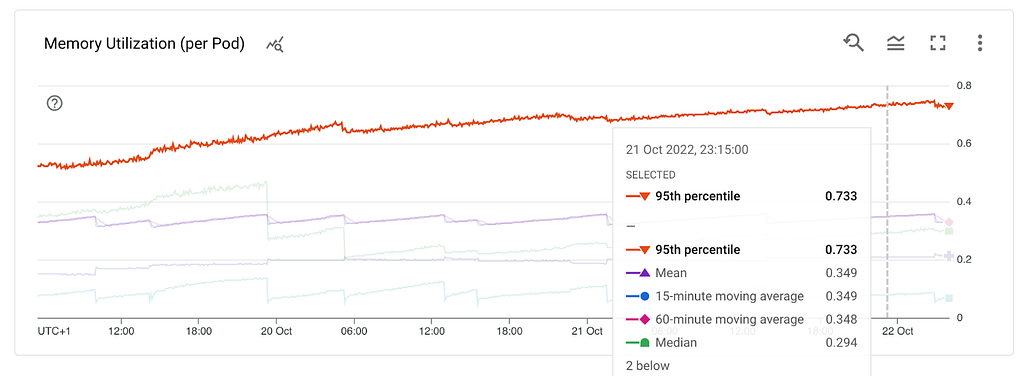
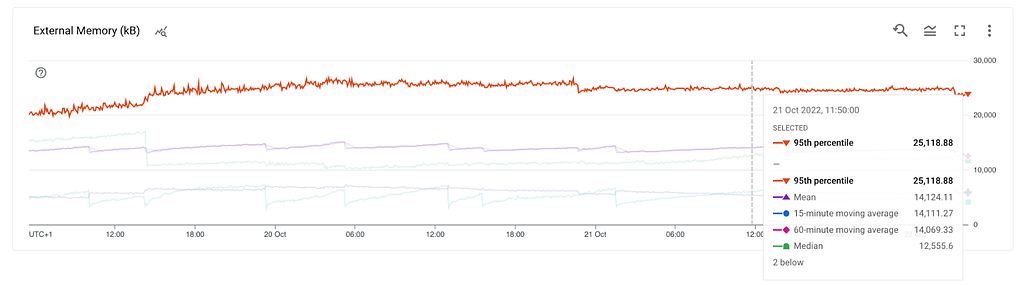
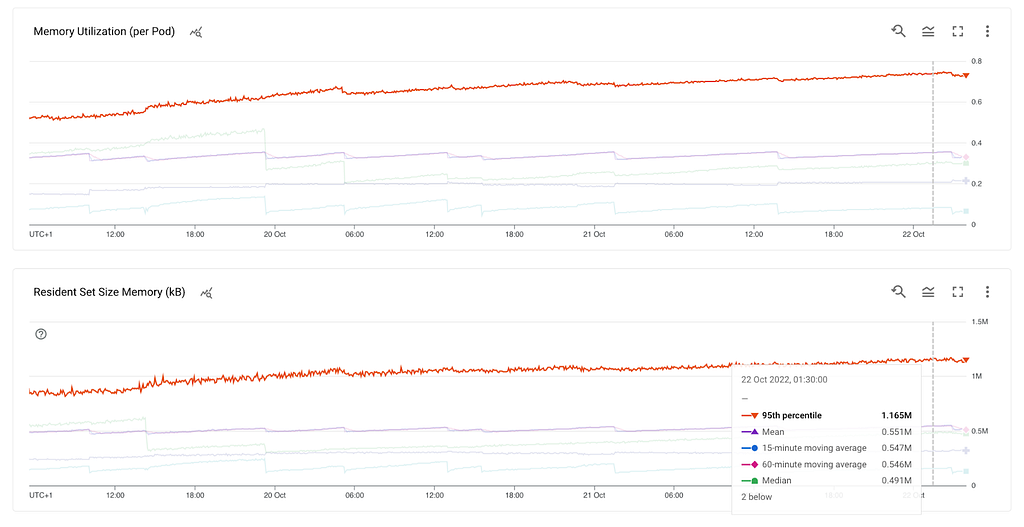
What do we know so far? RSS is growing, the heap and external are stable which leads us to the stack. This could mean a method that gets called and never exits, thus leading to a stack overflow. However, the stack can’t be hundreds of MBs. At this point, we already tested in a non-production environment with multiple thousands of stations but didn’t get any results.
Memory allocator
While brainstorming, we considered memory fragmentation: chunks of memory are allocated non-sequentially leading to small chunks of memory that can’t be used for new allocations. In our case, the application is long-running and does a lot of allocation and freeing. Memory fragmentation is a valid concern in these cases. Extensive googling led us to a GitHub issue where the folks faced the same situation as us. The same pattern of the memory leak was observed, and it aligned with our hypothesis.
We decided to put a different memory allocator to test, and we switched from musl to jemalloc. We found no meaningful results. At this point, we knew we needed to take a break. We had to rethink the approach entirely.
Could it be that the leak only appears on mTLS connections?
During our first tests, we tried to reproduce the issue in a non-production environment but had no luck. We ran load tests with thousands of stations simulating different scenarios, connecting/disconnecting stations for days, but they produced no meaningful results. However, we started to have a growing suspicion that there was something we missed while running these tests.
We didn’t take into account that our stations can connect via TLS or mTLS. Our first test included TLS stations, but not mTLS, and the reason for that is simple: we couldn’t easily create mTLS stations and the respective client certificates. A recent incident motivated us to minimise the blast radius and split the application’s responsibilities so that each deployment would handle TLS and mTLS traffic separately. Eureka! The memory leak appears only on our mTLS pods, while on TLS the memory is stable.
Where do we go from here?
We decided that there are two options: (1) Move on to our next suspects — a library that handles all the Public Key Infrastructure tasks as well as a potential recursion somewhere in that code path, (2) or live with it until we rework our service entirely.
During the memory leak investigation, many unforeseen topics were brought to our attention that were related to the affected service. Taking into account the memory leak and everything else we discovered, we decided to improve our service landscape and split the responsibilities of the service. The CS authentication and authorisation flow, among others, would be delegated to the new service and we would use the right tools for handling PKI tasks.
Summary
Improving our scaling revealed that we have a memory leak that could have been left unnoticed for an indefinite period of time. Prioritising the customer and assessing the impact of the leak was first and foremost. Only then were we able to set the pace of our investigation since we realised that there was no customer impact. We started with the most obvious place to look when diagnosing a memory leak — the heap. Analysing the heap, however, showed us that we were looking at the wrong place. Further clues were needed and the process API of V8 gave us exactly that. In the first results we got, the memory leak appeared in RSS. Finally, analysing all the information gathered, we suspected memory fragmentation.
Changing the memory allocator didn’t improve the situation. Rather, changing our approach and splitting the workload between TLS and mTLS, helped us narrow down the code path affected.
What were the final outcomes of our investigation?
Our plans to improve scalability along with addressing the memory leak, made us decide to split the service and write a new one to take care of the CS connectivity flow separately from the other CS specifics.
Did we fix our memory leak?
Time will tell, but I would say the investigation was way more than that. The experience of probing into the leak helped us grow as developers and our service to adopt a more resilient and scalable architecture.
Key points and learnings
- Τough engineering challenges bring people together; we played ping-pong on ideas with engineers outside of our team.
- Gave us the motivation to rethink the service, which led to a more scalable architecture.
- If it aches, it requires your attention; don’t ignore it.
References
- https://nodejs.org/en/docs/guides/diagnostics/memory/using-heap-snapshot/
- Enable remote debugging to a pod via port forwarding: https://kubernetes.io/docs/tasks/access-application-cluster/port-forward-access-application-cluster/
- https://developers.google.com/cast/docs/debugging/remote_debugger
Learn More

If you are interested in finding out more about how we work, please subscribe to the Elli Medium blog and visit our company’s website at elli.eco! See you next time!
About the author
Thanos Amoutzias is a Software Engineer, he develops Elli’s Charging Station Management System and drives SRE topics. He is passionate about building reliable services and delivering impactful products. You can find him on LinkedIn and in the 🏔️.
Credits: Thanks to all my colleagues who reviewed and gave feedback on the article!
Catch Me If You Can — Memory Leaks was originally published in Elli Engineering on Medium, where people are continuing the conversation by highlighting and responding to this story.


